Managers can stay up to date on their store's performance at any time via the Reports tab in the Backoffice. Here is a quick overview of the reporting features made available to store managers:
To access your reporting, visit the Reports tab in your Backoffice (below):

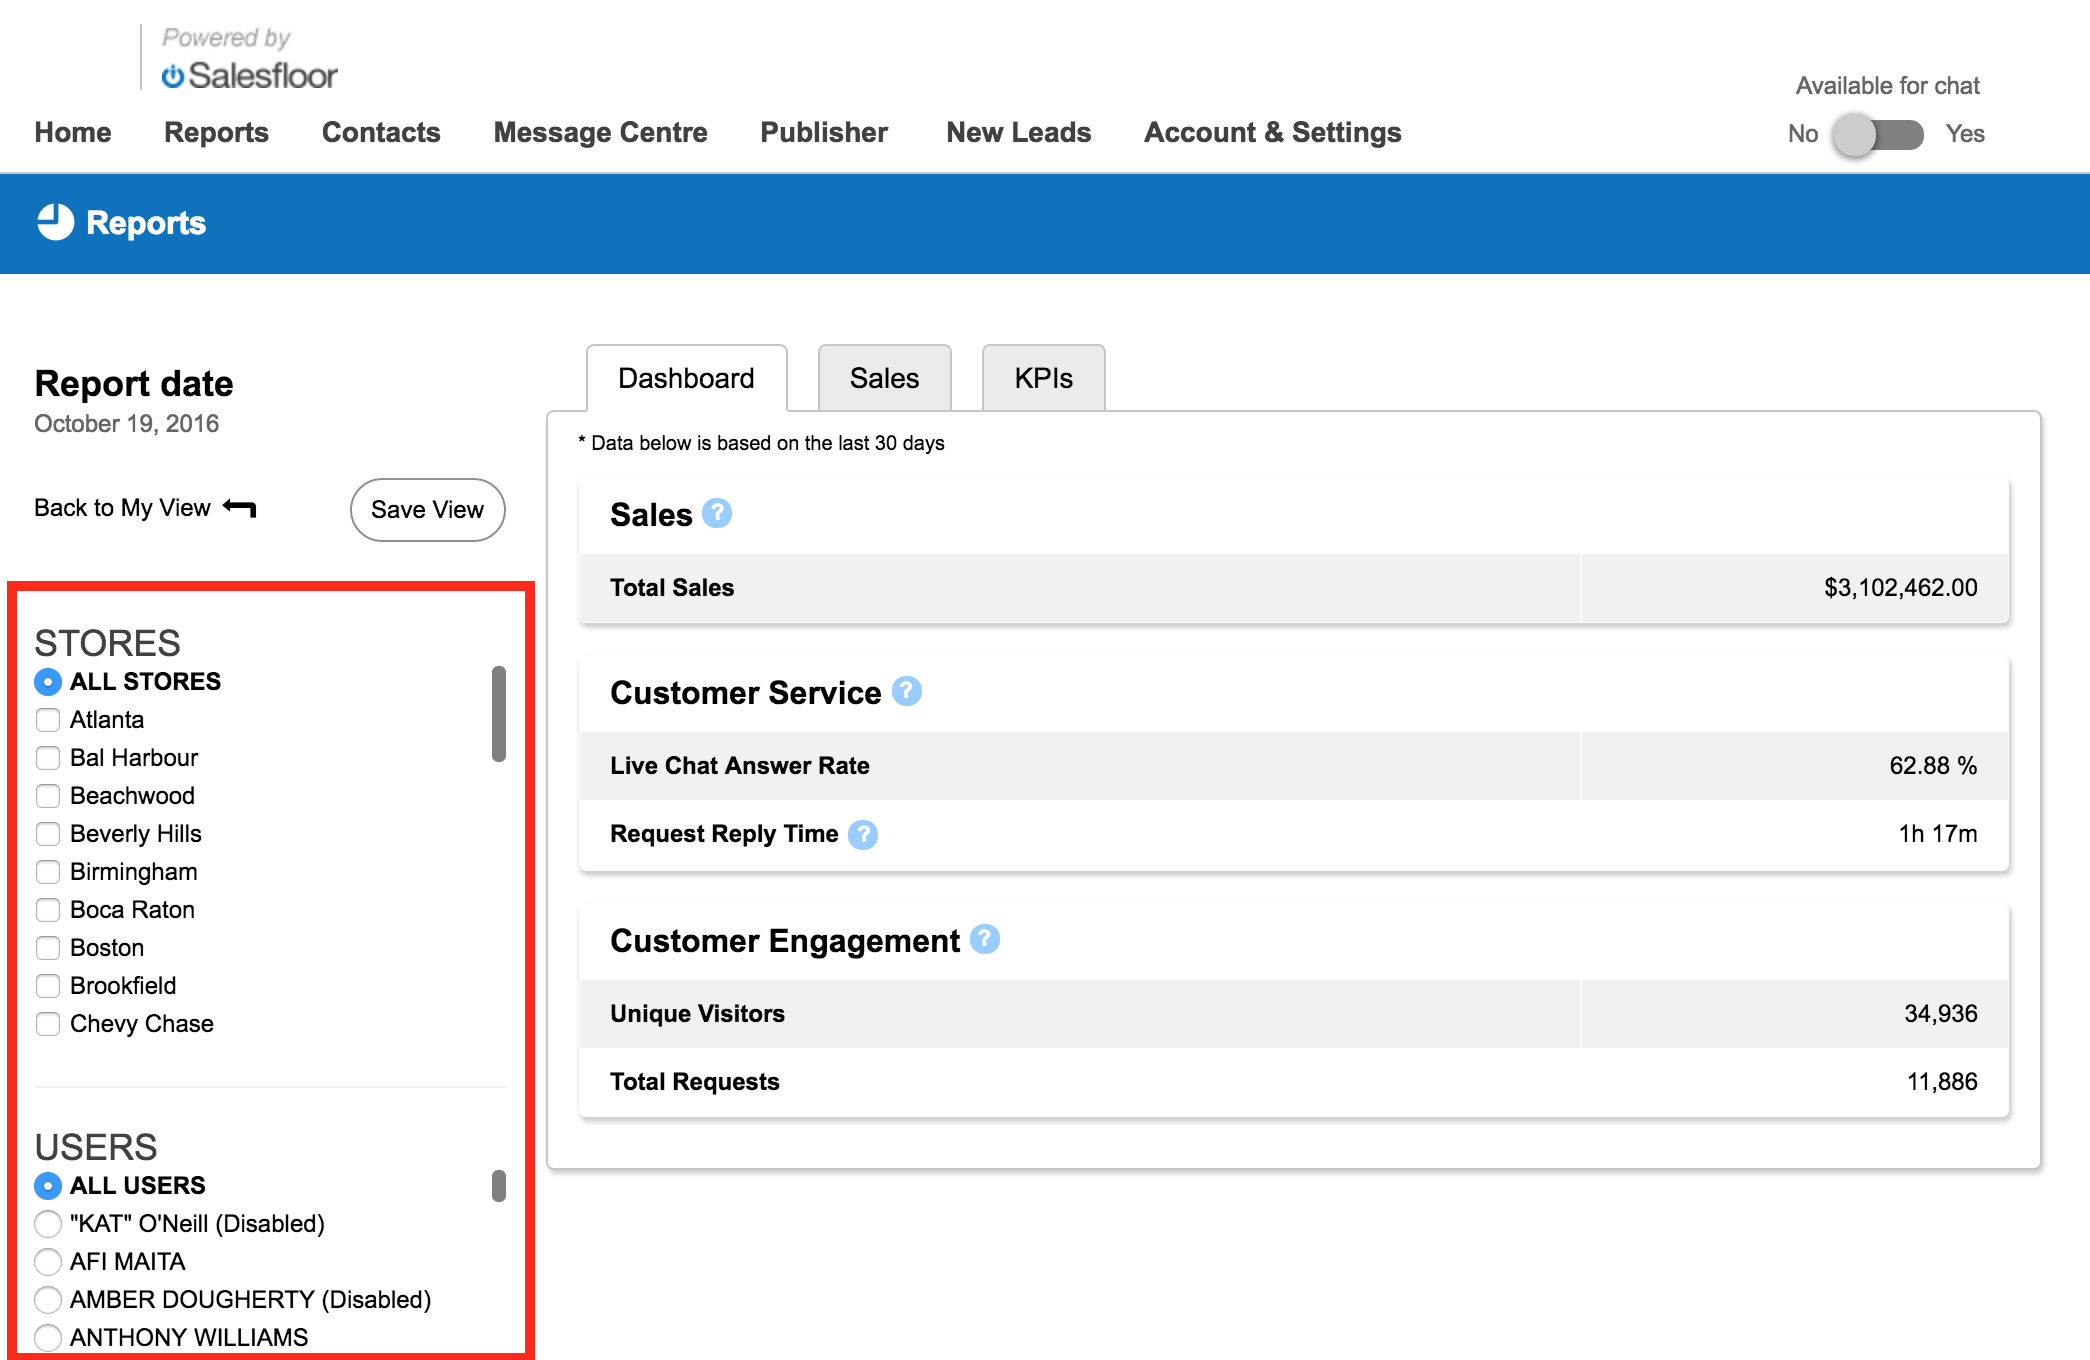
To help managers better address the associates at their location, Salesfloor reporting metrics can be filtered by both all or individual locations, and all or individual associates depending on your account type permissions

![]()
Once you've selected the location(s) and associate(s) that you are looking for, click the Run Report button (above), to apply your filter:
After your page has refreshed to meet your filter criteria, there are 3 tabs through which Salesfloor presents the location and/or associate's performance metrics:
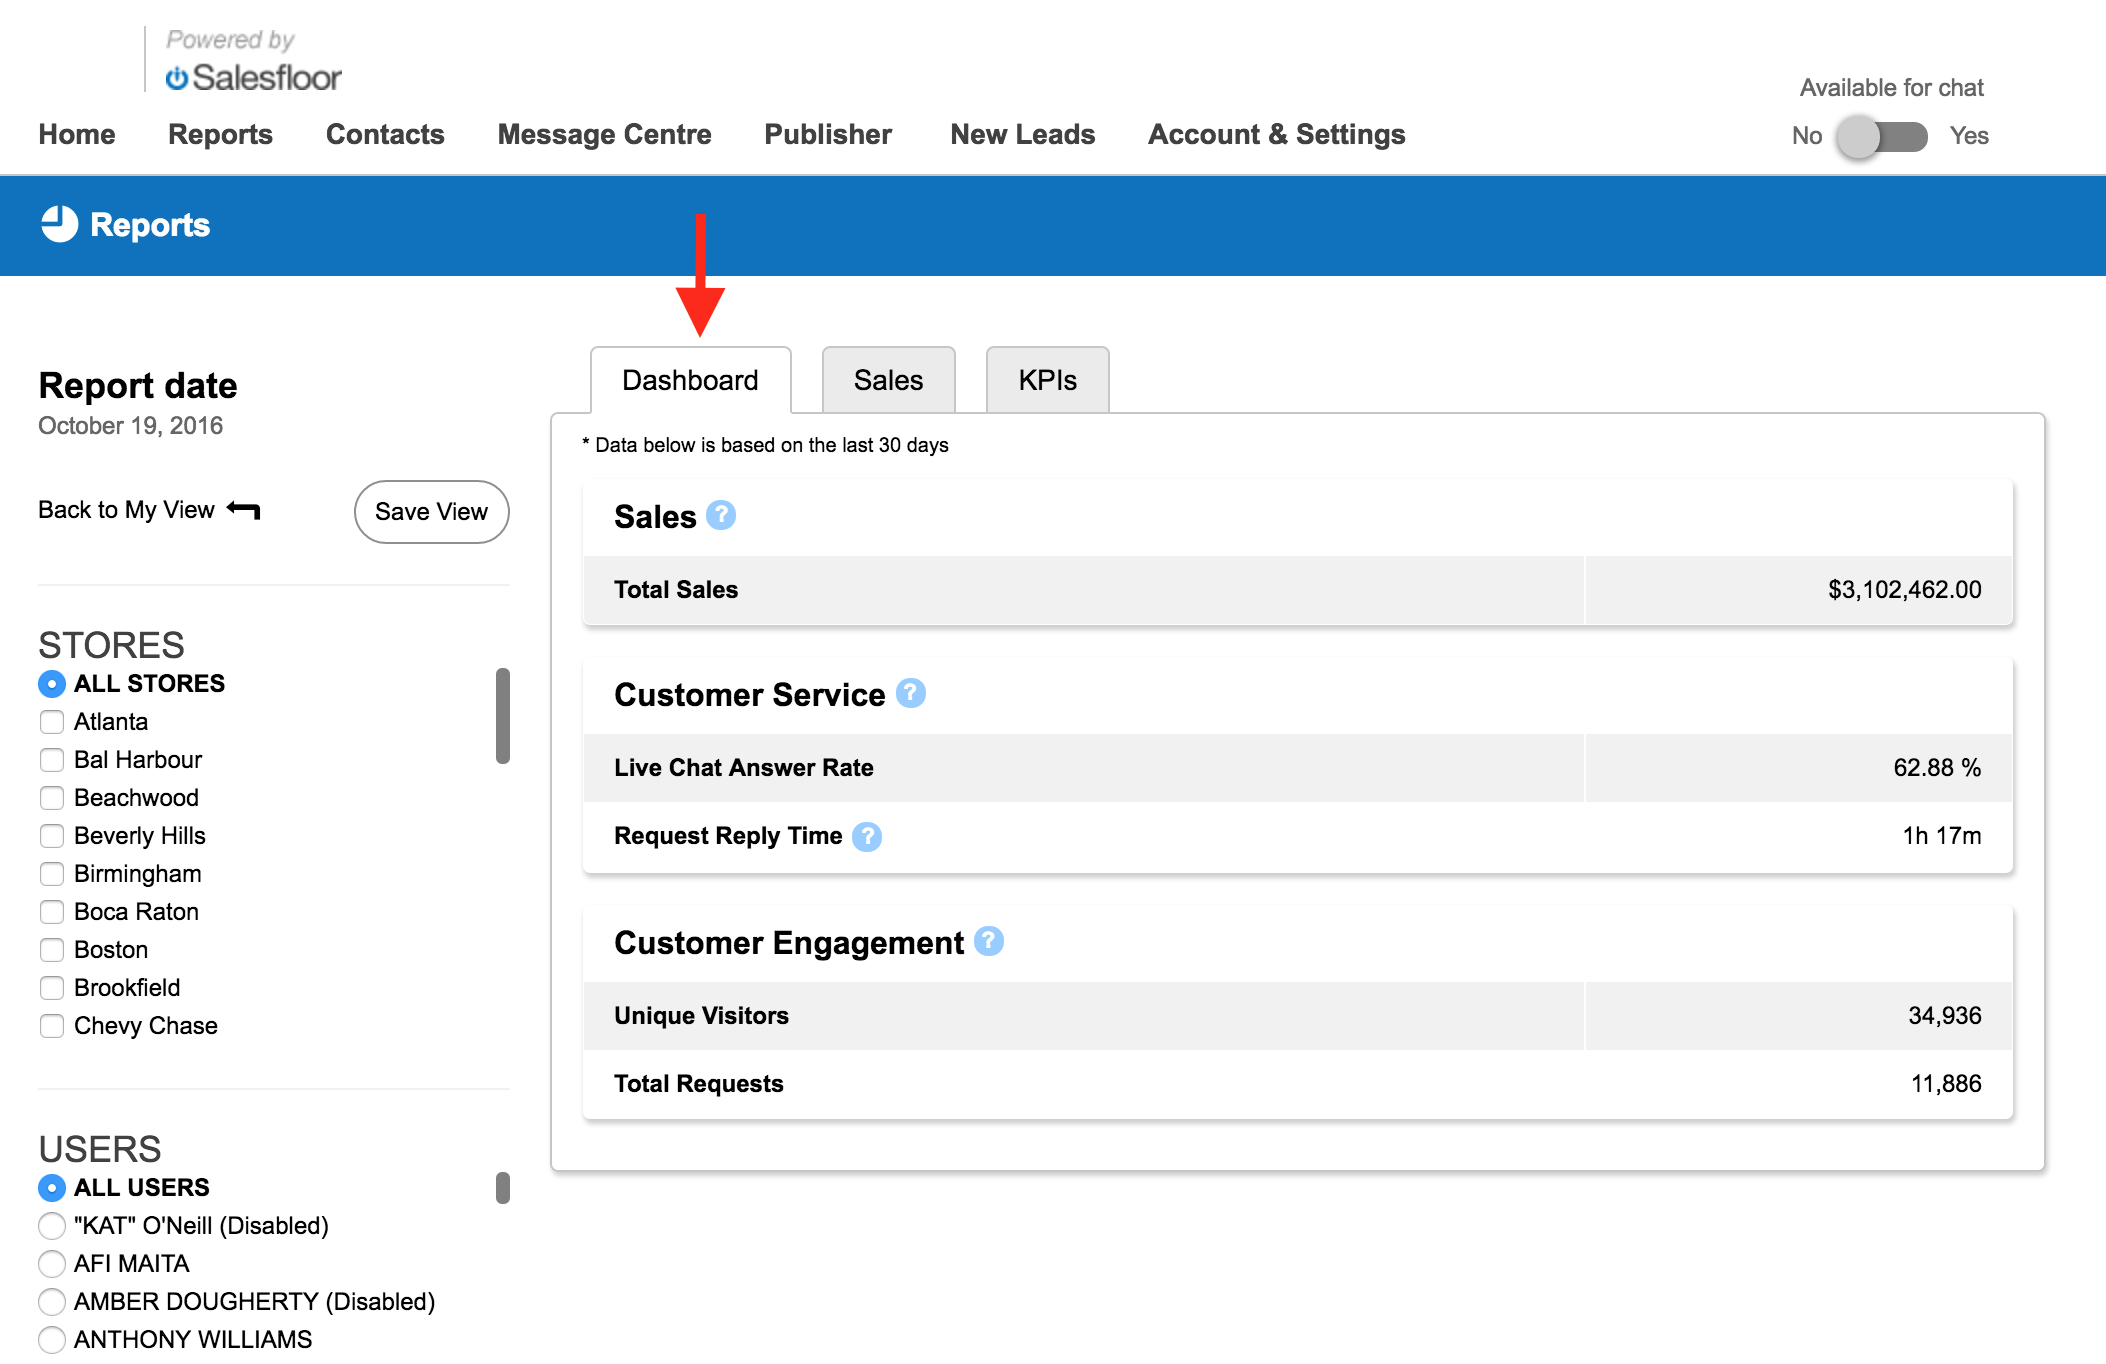
The Dashboard Tab
The Dashboard Tab serves as a summary of the top performance KPIs, relevant to your filter criteria. This is where you will find the total sales made since the location or associate has joined Salesfloor, the Live Chat Answer Rate, the Request Reply Time, the number of unique Storefront Visits, and the total number of customer requests received:

The Sales Tab
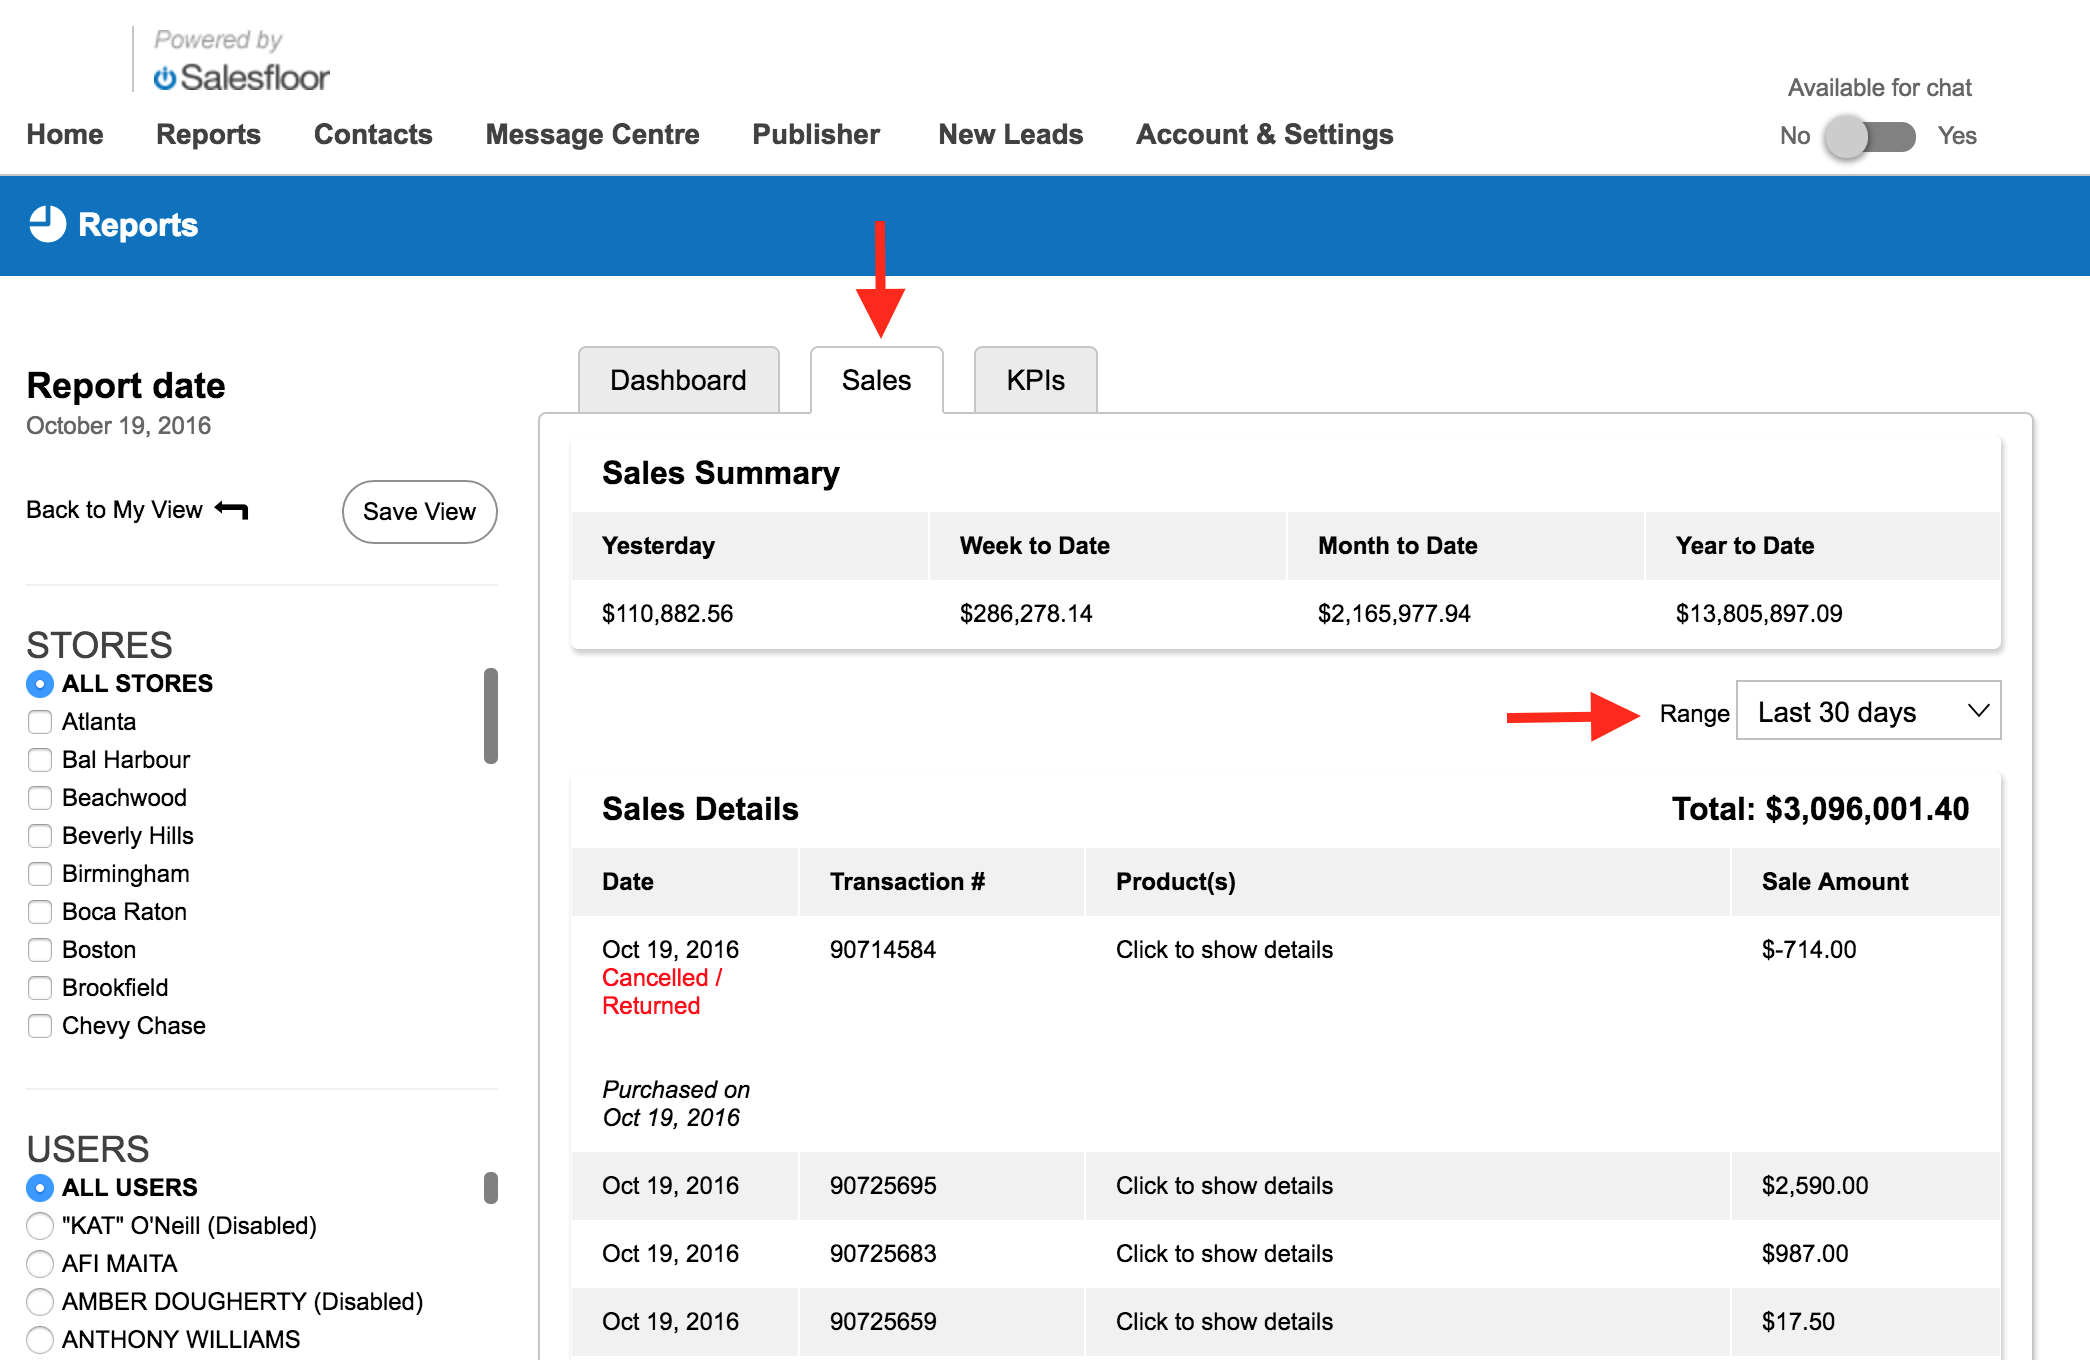
The Sales Tab is where managers and associates alike can review all sales made with Salesfloor. The Sales Summary component serves to provide a glimpse at the location and/or associate's total sales by time period: Yesterday, Week to Date, Month to Date, and Year to Date. Managers can also customize the date range to review transactions in the Sales Details component. After setting your preferred time period using the Range filter, managers can review all sales relevant to the time period chosen:

The KPI Tab
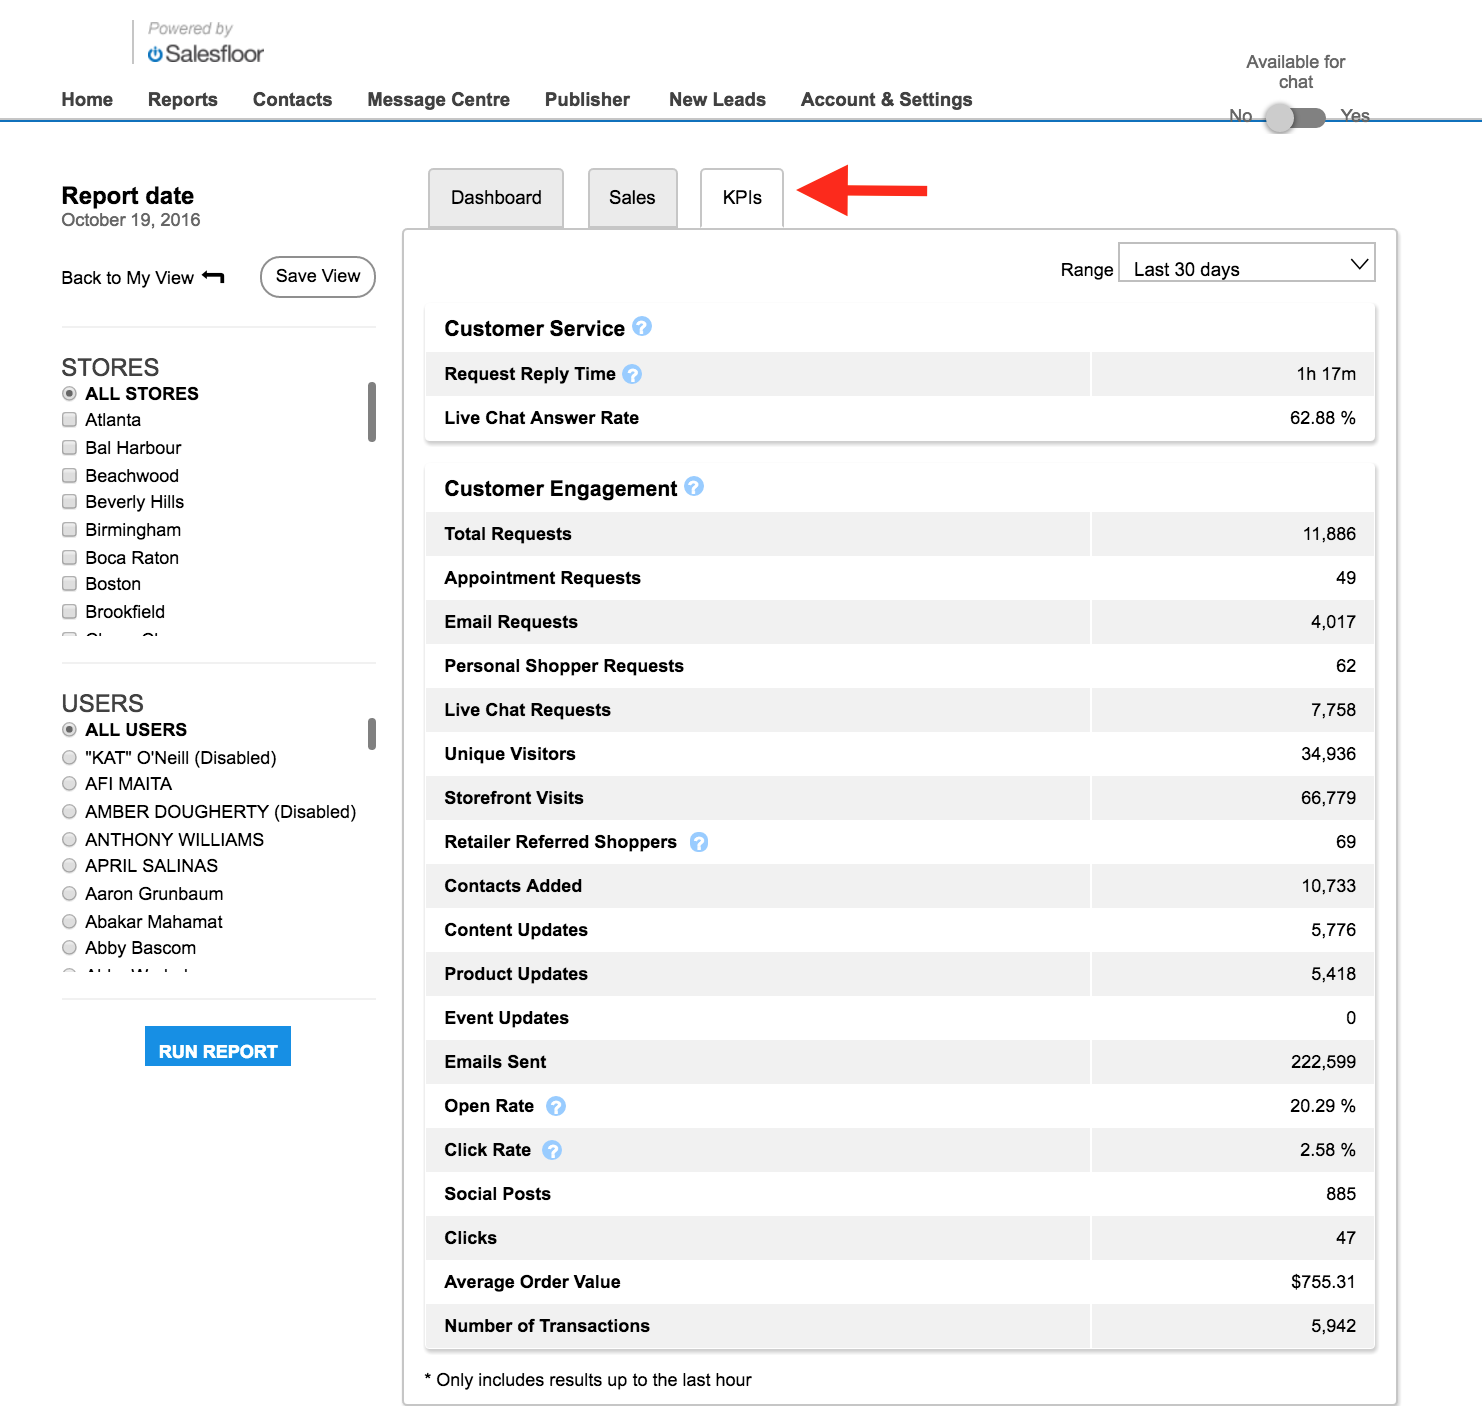
The KPI Tab serves as a summary of all KPIs applicable to the location and/or associate(s) chosen. Similar to the Sales Tab, the KPI Tab can be filtered to display KPI metrics relevant to various time periods. For KPI definitions, visit our KPI Glossary

